- Data Collection
- Introduction
- 1. Overview
-
2.
Use Cases
- 2.1. Centralized App Logging
- 2.2. Log Management & Search
- 2.3. Secure Log Forwarding
- 2.4. Log Filtering and Alerting
- 2.5. Big Data Analytics
- 2.6. Data Archiving to S3
- 2.7. Data Collection to MongoDB
- 2.8. Data Collection to HDFS
- 2.9. Data Collection to Riak
- 2.10. Windows Data Collection
- 2.11. Raspberry Pi Data Collection
- 2.12. GlusterFS Data Collection
- 2.13. Fluentd and Norikra
-
3.
Configuration
- 3.1. Configuration file
- 3.2. Common Log Formats
- 3.3. Apache Logs to Elasticsearch
- 3.4. Apache Logs to MongoDB
- 3.5. Apache Logs to S3
- 3.6. Apache Logs to Treasure Data
- 3.7. Cloudstack to MongoDB
- 3.8. CSV to Elasticsearch
- 3.9. CSV to MongoDB
- 3.10. CSV to S3
- 3.11. CSV to Treasure Data
- 3.12. HTTP to Elasticsearch
- 3.13. HTTP to MongoDB
- 3.14. HTTP to S3
- 3.15. HTTP to Treasure Data
- 3.16. Nginx to Elasticsearch
- 3.17. Nginx to MongoDB
- 3.18. Nginx to S3
- 3.19. Nginx to Treasure Data
- 3.20. Syslog to Elasticsearch
- 3.21. Syslog to MongoDB
- 3.22. Syslog to S3
- 3.23. Syslog to Treasure Data
- 3.24. TSV to S3
- 3.25. TSV to Elasticsearch
- 3.26. TSV to MongoDB
- 3.27. TSV to Treasure Data
- 3.28. JSON to Elasticsearch
- 3.29. JSON to MongoDB
- 3.30. JSON to S3
- 3.31. JSON to TreasureData
- 4. Deployment
- 5. Input Plugins
- 6. Output Plugins
- 7. Buffer Plugins
- 8. Filter Plugins
- 9. Parser Plugins
- 10. Formatter Plugins
- 11. Developer
Log Management and Search
Free Alternative to Splunk Using Fluentd
Splunk is a great tool for searching logs, but its high cost makes it prohibitive for many teams. In this article, we present a free and open source alternative to Splunk by combining three open source projects: Elasticsearch, Kibana, and Fluentd.
Elasticsearch is an open source search engine known for its ease of use. Kibana is an open source Web UI that makes Elasticsearch user friendly for marketers, engineers and data scientists alike.
By combining these three tools (Fluentd + Elasticsearch + Kibana) we get a scalable, flexible, easy to use log search engine with a great Web UI that provides an open-source Splunk alternative, all for free.
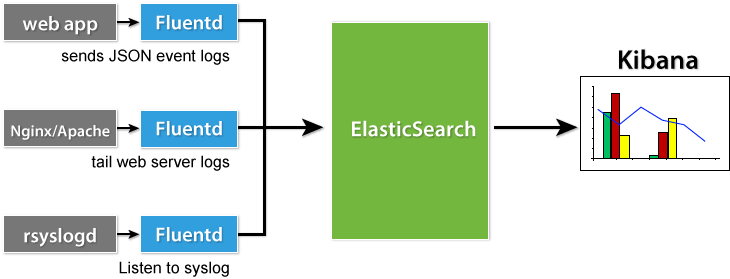
In this guide, we will go over installation, setup, and basic use of this combined log search solution. This article was tested on Mac OS X Mountain Lion. If you're not familiar with Fluentd, please learn more about Fluentd first.
Prerequisites
Java for Elasticsearch
Please confirm that your Java version is 6 or higher.
$ java -version
java version "1.6.0_45"
Java(TM) SE Runtime Environment (build 1.6.0_45-b06-451-11M4406)
Java HotSpot(TM) 64-Bit Server VM (build 20.45-b01-451, mixed mode)
Now that we've checked for prerequisites, we're now ready to install and set up the three open source tools.
Set Up Elasticsearch
To install Elasticsearch, please download and extract the Elasticsearch package as shown below.
$ curl -O https://download.elasticsearch.org/elasticsearch/elasticsearch/elasticsearch-0.90.0.RC2.tar.gz
$ tar zxvf elasticsearch-0.90.0.RC2.tar.gz
$ cd elasticsearch-0.90.0.RC2/
Once installation is complete, start Elasticsearch.
$ ./bin/elasticsearch -f
Set Up Kibana
To install Kibana, download it via the official webpage and extract it. Kibana is a HTML / CSS / JavaScript application.
$ curl -O https://download.elasticsearch.org/kibana/kibana/kibana-3.0.0milestone5.tar.gz
$ tar zxvf kibana-3.0.0milestone5.tar.gz
$ cd kibana-3.0.0milestone5/
Once installation is complete, start Kibana and open index.html. You can modify Kibana's configuration via config.js.
$ open index.html
Set Up Fluentd (td-agent)
In this guide We'll install td-agent, the stable release of Fluentd. Please refer to the guides below for detailed installation steps.
Next, we'll install the Elasticsearch plugin for Fluentd: fluent-plugin-elasticsearch.
NOTE: The latest version of fluent-plugin-elasticsearch requires libcurl and make (if your system has no "make"). For Ubuntu, run "sudo apt-get install libcurl4-gnutls-dev". For RedHat/CentOS, run "sudo yum install libcurl-devel".
Then, install fluent-plugin-elasticsearch as follows.
- td-agent v2:
/usr/sbin/td-agent-gem install fluent-plugin-elasticsearch - td-agent v1:
/usr/lib/fluent/ruby/bin/fluent-gem install fluent-plugin-elasticsearch
We'll configure td-agent (Fluentd) to interface properly with Elasticsearch. Please modify /etc/td-agent/td-agent.conf as shown below:
<source>
  type syslog
  port 42185
  tag syslog
</source>

<source>
  type forward
</source>

<match syslog.**>
  type elasticsearch
  logstash_format true
  flush_interval 10s # for testing
</match>
fluent-plugin-elasticsearch comes with a logstash_format option that allows Kibana to search stored event logs in Elasticsearch.
Once everything has been set up and configured, we'll start td-agent.
$ sudo /etc/init.d/td-agent start
Set Up rsyslogd
In our final step, we'll forward the logs from your rsyslogd to Fluentd. Please add the following line to your /etc/rsyslog.conf, and restart rsyslog. This will forward your local syslog to Fluentd, and Fluentd in turn will forward the logs to Elasticsearch.
*.* @127.0.0.1:42185
Please restart the rsyslog service once the modification is complete.
$ sudo /etc/init.d/rsyslog restart
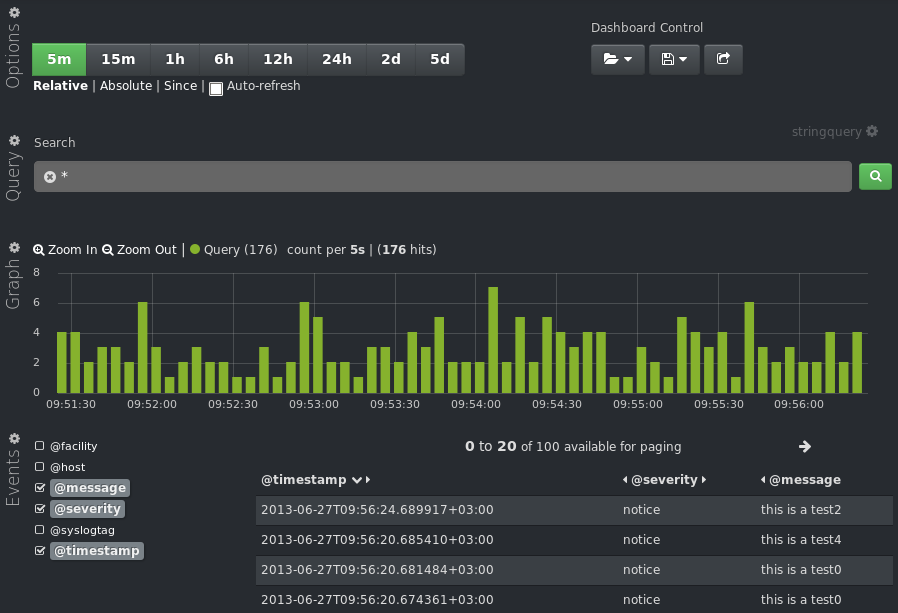
Store and Search Event Logs
Once Fluentd receives some event logs from rsyslog and has flushed them to Elasticsearch, you can search the stored logs using Kibana by accessing Kibana's index.html in your browser.
To manually send logs to Elasticsearch, please use the logger command.
$ logger -t test foobar
When debugging your td-agent configuration, using out_copy + out_stdout will be useful. All the logs including errors can be found at /etc/td-agent/td-agent.log.
<match syslog.**>
  type copy
  <store>
    # for debug (see /var/log/td-agent.log)
    type stdout
  </store>
  <store>
    type elasticsearch
    logstash_format true
    flush_interval 10s # for testing
  </store>
</match>
Demo Environment
Please access the Kibana Demo Environment from the link below.
Conclusion
This article introduced the combination of Fluentd and Kibana (with Elasticsearch) which achieves a free alternative to Splunk: storing and searching machine logs. The examples provided in this article have not been tuned.
If you will be using these components in production, you may want to modify some of the configurations (e.g. JVM, Elasticsearch, Fluentd buffer, etc.) according to your needs.