- Data Collection
- Introduction
- 1. Overview
-
2.
Use Cases
- 2.1. Centralized App Logging
- 2.2. Log Management & Search
- 2.3. Secure Log Forwarding
- 2.4. Log Filtering and Alerting
- 2.5. Big Data Analytics
- 2.6. Data Archiving to S3
- 2.7. Data Collection to MongoDB
- 2.8. Data Collection to HDFS
- 2.9. Data Collection to Riak
- 2.10. Windows Data Collection
- 2.11. Raspberry Pi Data Collection
- 2.12. GlusterFS Data Collection
- 2.13. Fluentd and Norikra
-
3.
Configuration
- 3.1. Configuration file
- 3.2. Common Log Formats
- 3.3. Apache Logs to Elasticsearch
- 3.4. Apache Logs to MongoDB
- 3.5. Apache Logs to S3
- 3.6. Apache Logs to Treasure Data
- 3.7. Cloudstack to MongoDB
- 3.8. CSV to Elasticsearch
- 3.9. CSV to MongoDB
- 3.10. CSV to S3
- 3.11. CSV to Treasure Data
- 3.12. HTTP to Elasticsearch
- 3.13. HTTP to MongoDB
- 3.14. HTTP to S3
- 3.15. HTTP to Treasure Data
- 3.16. Nginx to Elasticsearch
- 3.17. Nginx to MongoDB
- 3.18. Nginx to S3
- 3.19. Nginx to Treasure Data
- 3.20. Syslog to Elasticsearch
- 3.21. Syslog to MongoDB
- 3.22. Syslog to S3
- 3.23. Syslog to Treasure Data
- 3.24. TSV to S3
- 3.25. TSV to Elasticsearch
- 3.26. TSV to MongoDB
- 3.27. TSV to Treasure Data
- 3.28. JSON to Elasticsearch
- 3.29. JSON to MongoDB
- 3.30. JSON to S3
- 3.31. JSON to TreasureData
- 4. Deployment
- 5. Input Plugins
- 6. Output Plugins
- 7. Buffer Plugins
- 8. Filter Plugins
- 9. Parser Plugins
- 10. Formatter Plugins
- 11. Developer
Collecting GlusterFS Logs with Fluentd
This article shows how to use Fluentd to collect GlusterFS logs for analysis (search, analytics, troubleshooting, etc.)
Background
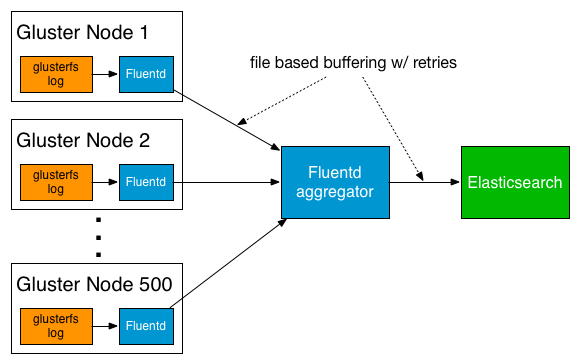
GlusterFS is an open source, distributed file system commercially supported by Red Hat, Inc. Each node in GlusterFS generates its own logs, and it's sometimes convenient to have these logs collected in a central location for analysis (e.g., When one GlusterFS node went down, what was happening on other nodes?).
Fluentd is an open source data collector for high-volume data streams. It's a great fit for monitoring GlusterFS clusters because:
- Fluentd supports GlusterFS logs as a data source.
- Fluentd supports various output systems (e.g., Elasticsearch, MongoDB, Treasure Data, etc.) that can help GlusterFS users analyze the logs.
The rest of this article explains how to set up Fluentd with GlusterFS. For this example, we chose Elasticsearch as the backend system.

Setting up Fluentd on GlusterFS Nodes
Installing Fluentd
First, we'll install Fluentd using the following command:
$ curl -L http://toolbelt.treasuredata.com/sh/install-redhat-td-agent2.sh | sh
Next, we'll install the Fluentd plugin for GlusterFS:
$ sudo /usr/sbin/td-agent-gem install fluent-plugin-glusterfs
Fetching: fluent-plugin-glusterfs-1.0.0.gem (100%)
Successfully installed fluent-plugin-glusterfs-1.0.0
1 gem installed
Installing ri documentation for fluent-plugin-glusterfs-1.0.0...
Installing RDoc documentation for fluent-plugin-glusterfs-1.0.0...
Making GlusterFS Log Files Readable by Fluentd
By default, only root can read the GlusterFS log files. We'll allow others to read the file.
$ ls -alF /var/log/glusterfs/etc-glusterfs-glusterd.vol.log
-rw------- 1 root root 1385  Feb  3 07:21 2014 /var/log/glusterfs/etc-glusterfs-glusterd.vol.log
$ sudo chmod +r /var/log/glusterfs/etc-glusterfs-glusterd.vol.log
$ ls -alF /var/log/glusterfs/etc-glusterfs-glusterd.vol.log
-rw-r--r-- 1 root root 1385  Feb  3 07:21 2014 /var/log/glusterfs/etc-glusterfs-glusterd.vol.log
Now, modify Fluentd's configuration file. It is located at /etc/td-agent/td-agent.conf.
NOTE: td-agent is Fluentd's rpm/deb package maintained by Treasure Data
This is what the configuration file should look like:
$ sudo cat /etc/td-agent/td-agent.conf

<source>
  type glusterfs_log
  path /var/log/glusterfs/etc-glusterfs-glusterd.vol.log
  pos_file /var/log/td-agent/etc-glusterfs-glusterd.vol.log.pos
  tag glusterfs_log.glusterd
  format /^(?<message>.*)$/
</source>

<match glusterfs_log.**>
  type forward
  send_timeout 60s
  recover_wait 10s
  heartbeat_interval 1s
  phi_threshold 8
  hard_timeout 60s

  <server>
    name logserver
    host 172.31.10.100
    port 24224
    weight 60
  </server>

  <secondary>
    type file
    path /var/log/td-agent/forward-failed
  </secondary>
</match>
NOTE: the
Finally, start td-agent. Fluentd will started with the updated setup.
$ sudo service td-agent start
Starting td-agent:                                         [  OK  ]
Setting Up the Aggregator Fluentd Server
We'll now set up a separate Fluentd instance to aggregate the logs. Again, the first step is to install Fluentd.
$ curl -L http://toolbelt.treasuredata.com/sh/install-redhat.sh | sh
We'll set up the node to send data to Elasticsearch, where the logs will be indexed and written to local disk for backup.
First, install the Elasticsearch output plugin as follows:
$ sudo /usr/lib64/fluent/ruby/bin/fluent-gem install fluent-plugin-glusterfs
Then, configure Fluentd as follows:
$ sudo cat /etc/td-agent/td-agent.conf
<source>
  type forward
  port 24224
  bind 0.0.0.0
</source>

<match glusterfs_log.glusterd>
  type copy

  #local backup
  <store>
    type file
    path /var/log/td-agent/glusterd
  </store>

  #Elasticsearch
  <store>
    type elasticsearch
    host ELASTICSEARCH_URL_HERE
    port 9200
    index_name glusterfs
    type_name fluentd
    logstash_format true
  </store>
</match>
That's it! You should now be able to search and visualize your GlusterFS logs with Kibana.
Acknowledgement
This article is inspired by Daisuke Sasaki's article on Classmethod's website. Thanks Daisuke!